Locomotive Rose Art
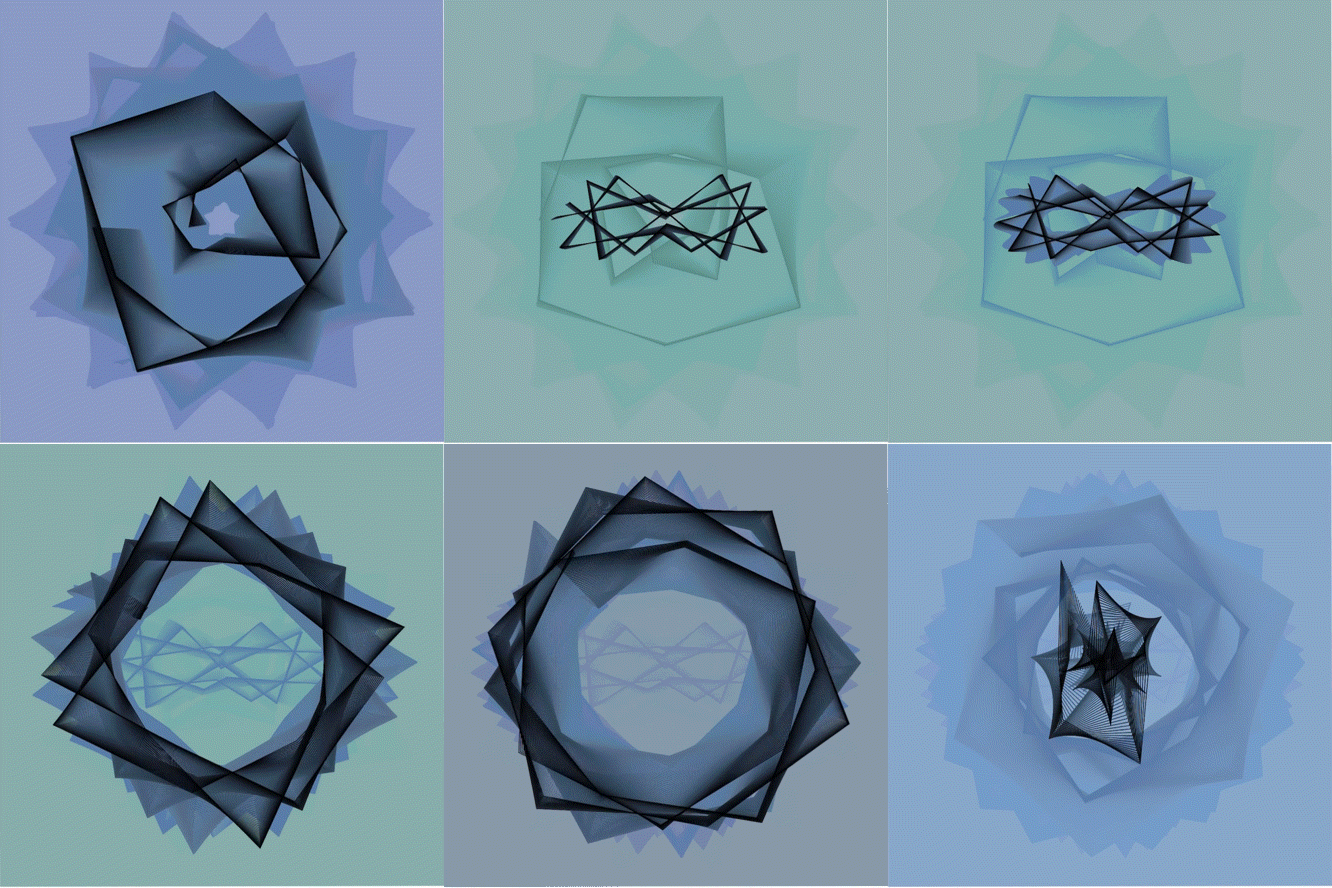

The equations used to produce these plots are in the family of rose curves. This particular form is composed of two curves added together. It almost feels like there is some locomotion happening in the visualization, and it is fun to think about the gears and shafts might that make this pattern.
r = a + b*cos(k(theta+60i))+ c*cos(m(theta +60i))

Bill Shillito posted a fun lesson plan on Twitter for these curves, calling them Rhodonoids, and I couldn’t resist playing around. After a few iterations of coding, I came up with the result below. Click to change the a,b,k,c, and m values of the curve. Math can be infinitely fun when you play.
See the Pen locomotiveRoses by Sophia (@fractalkitty) on CodePen.





Member discussion